SDG&E Field Service Scheduling Intelligence (Industry Capstone)
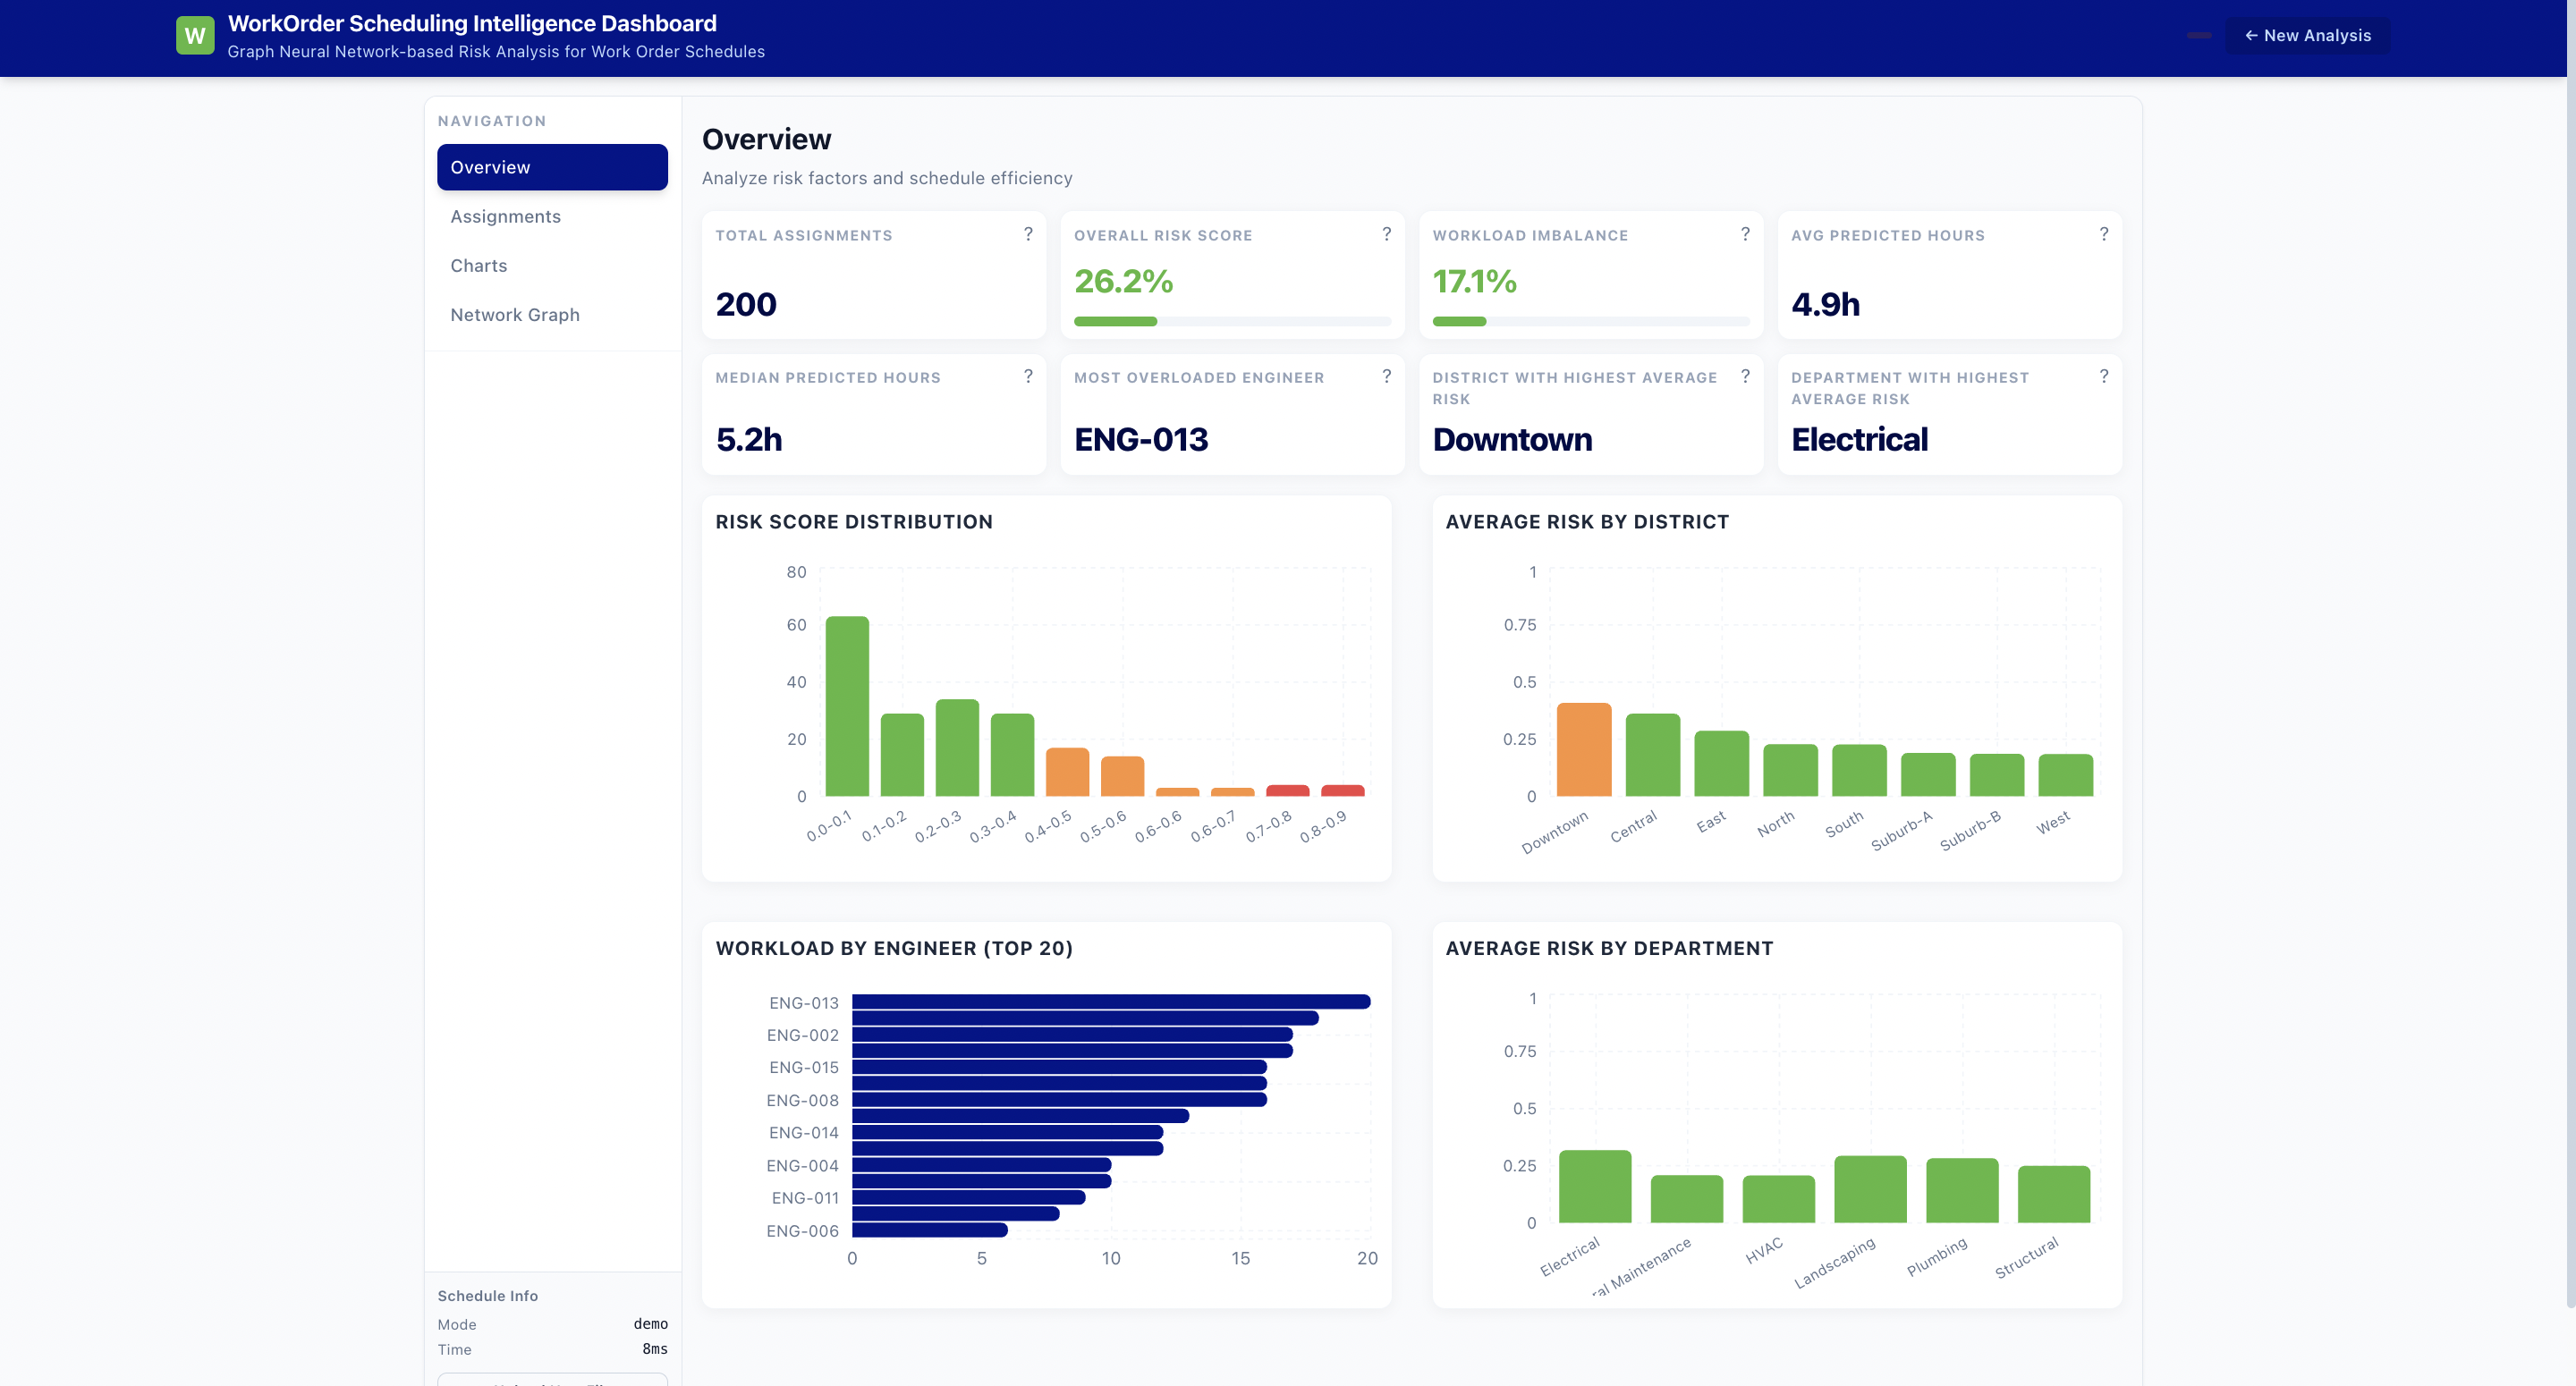
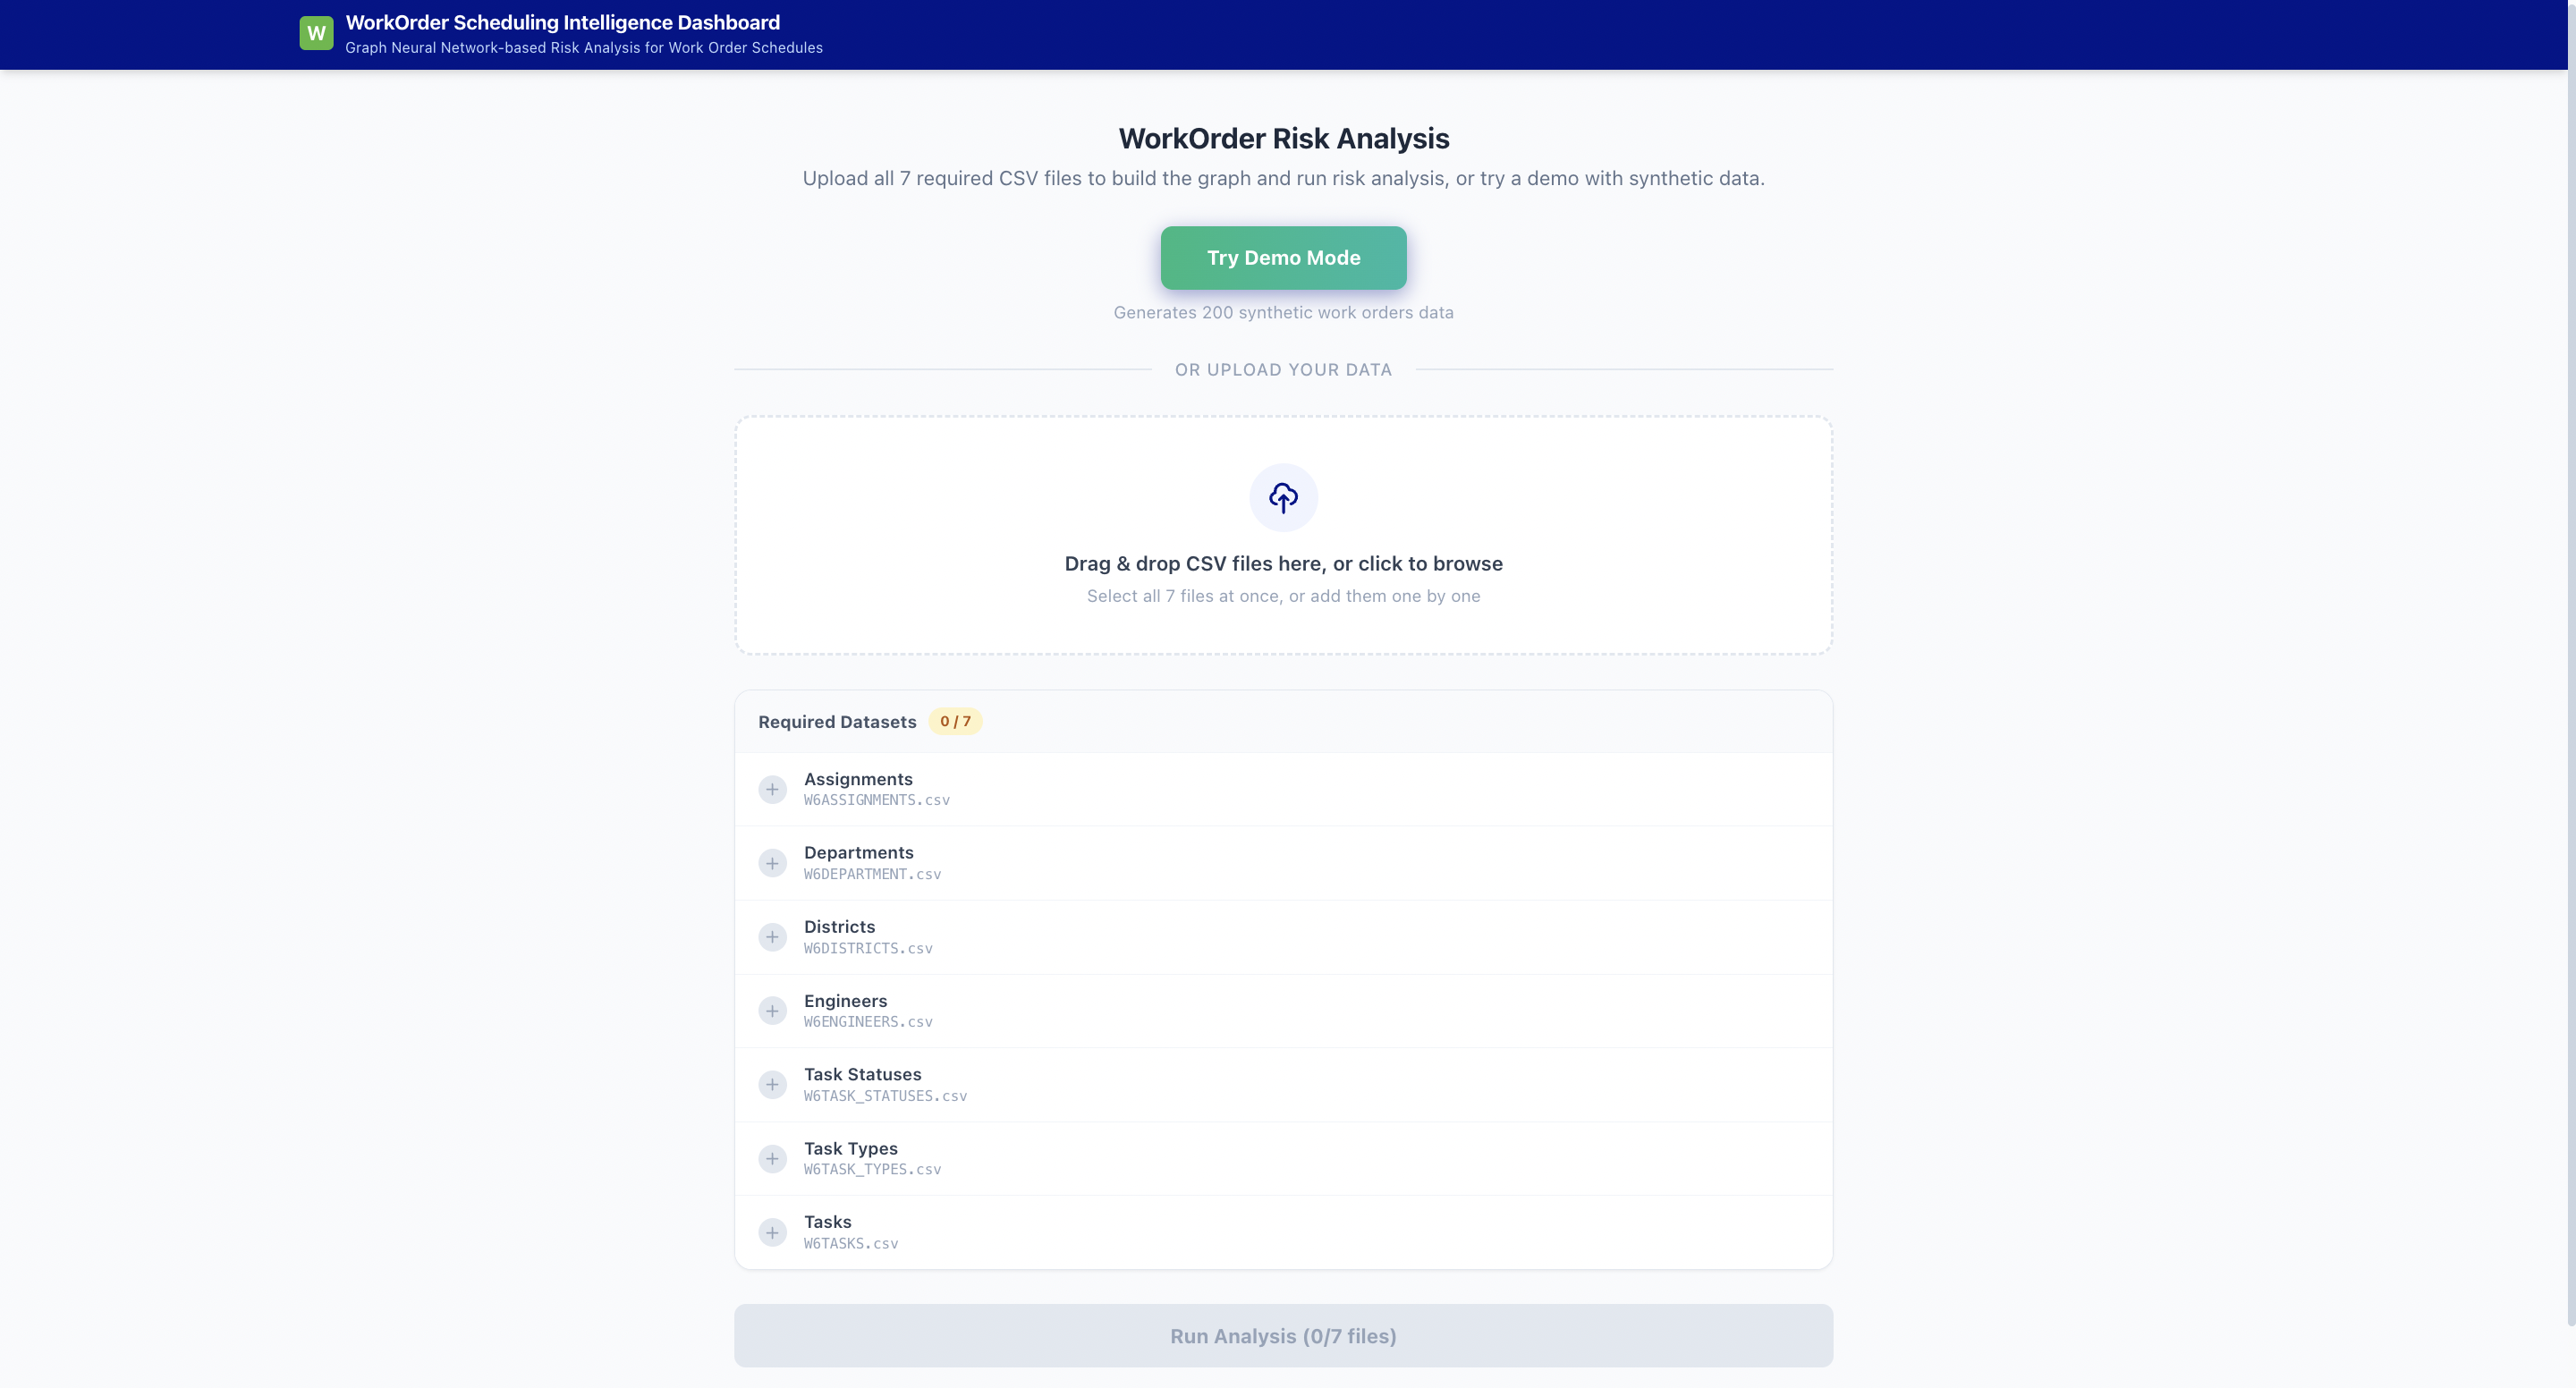
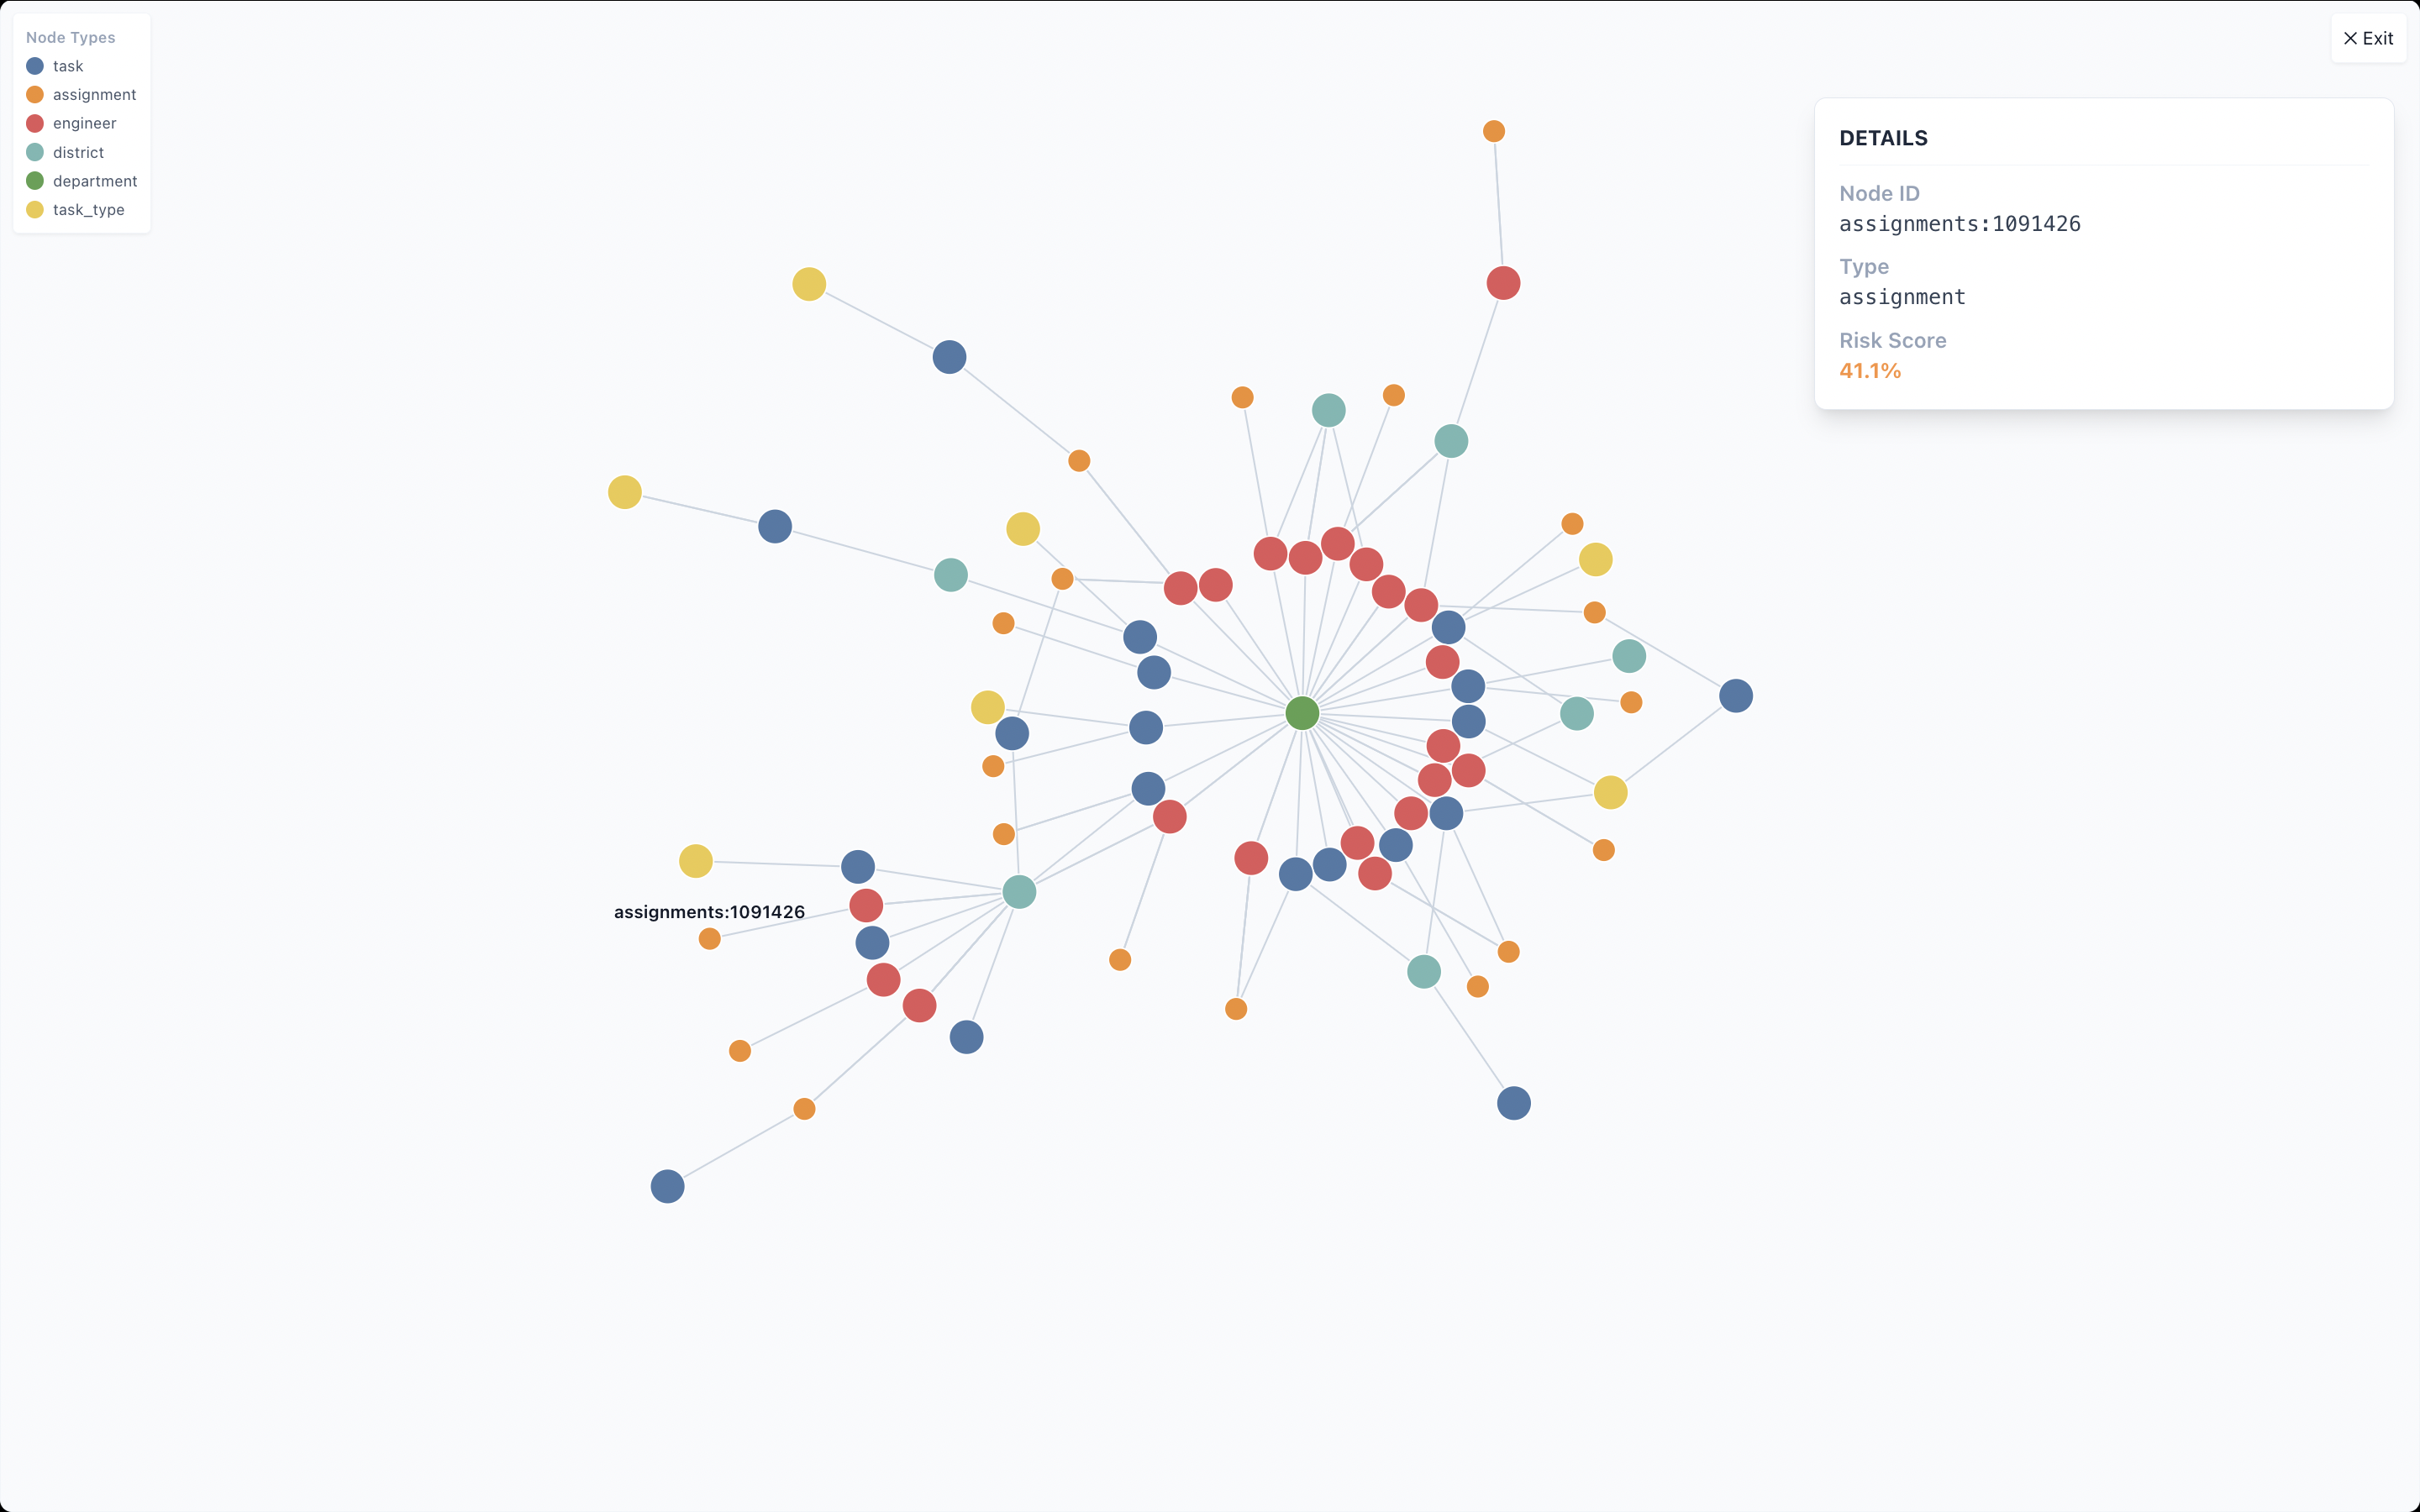
In this project, we explore how graph-based machine learning model can improve understanding of large-scale utility scheduling systems. In collaboration with San Diego Gas & Electric (SDG&E), we modeled operational scheduling data as a heterogeneous graph connecting tasks, engineers, districts, and assignments. Using Graph Neural Networks (GNNs), the model captures relational dependencies such as workload interactions and delay propagation that are difficult to observe using traditional tabular approaches. We also developed an full-stack web application that allows users to upload scheduling data, analyze predicted risk metrics, and explore the scheduling network through dashboards and graph visualizations.
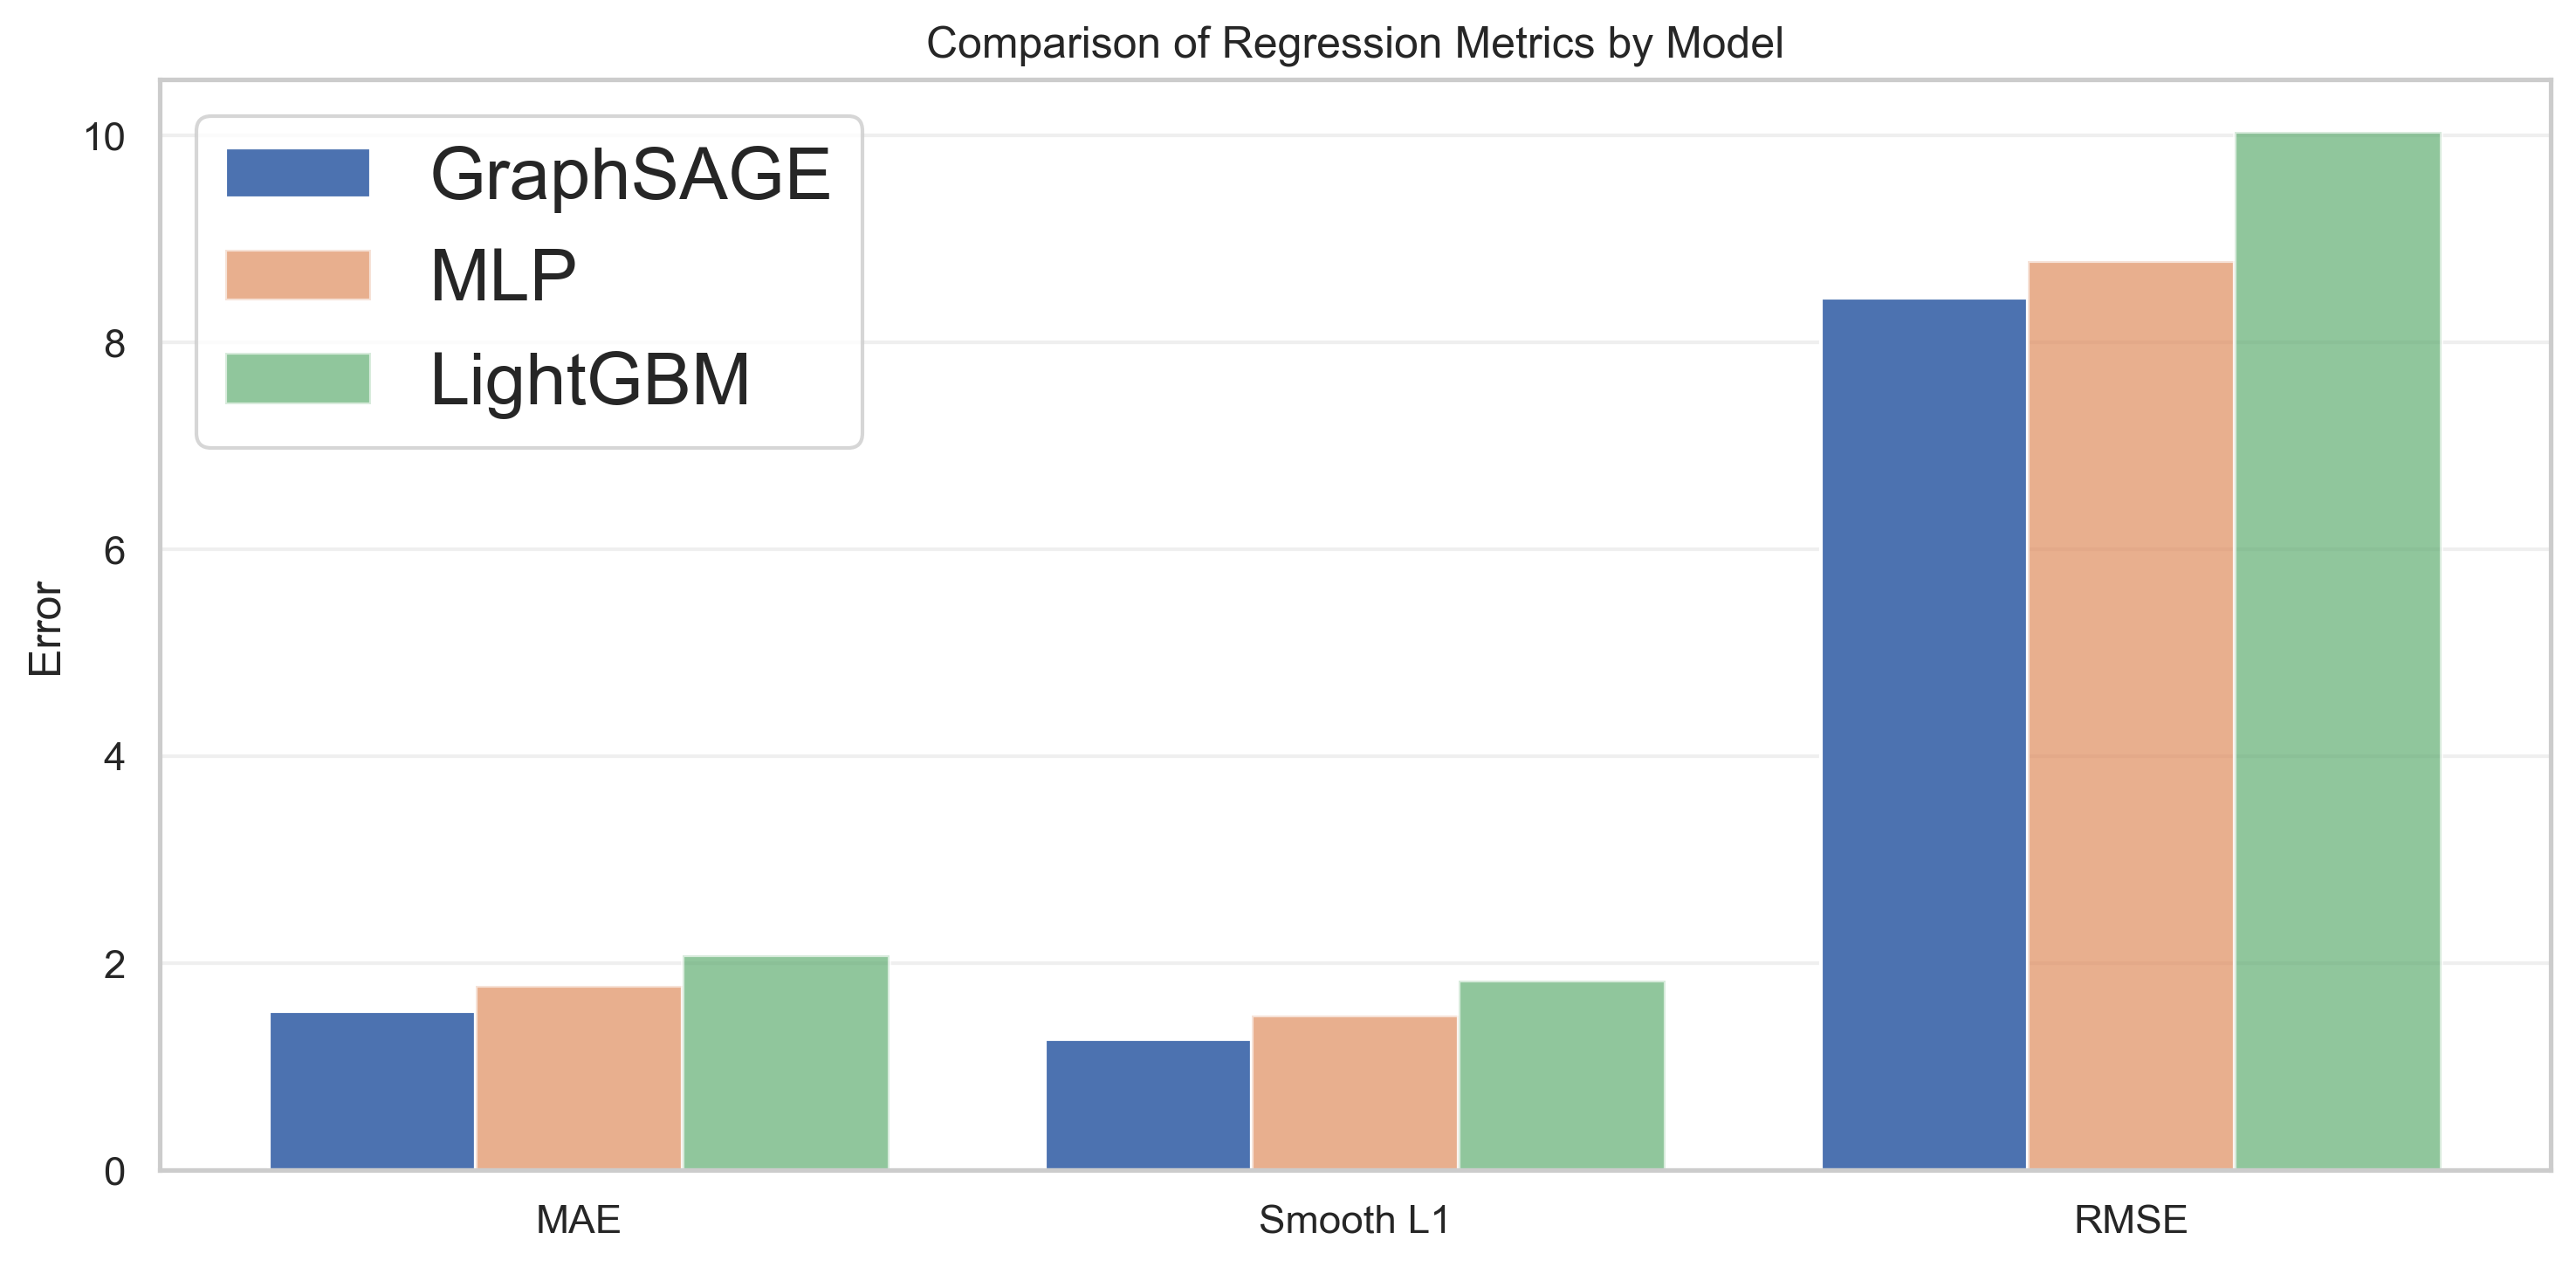
Specifcally, we use GraphSAGE (Graph SAmple and aggreGatE) model to learn node representations by aggregating information from neighboring nodes in the scheduling graph. We compare the graph-based model with two baseline approaches: a Multi-Layer Perceptron (MLP) and Light Gradient-Boosting Machine (LightGBM). The GraphSAGE model achieves the lowest prediction error across all evaluation metrics, showing the advantage of incorporating relational structure during prediction.
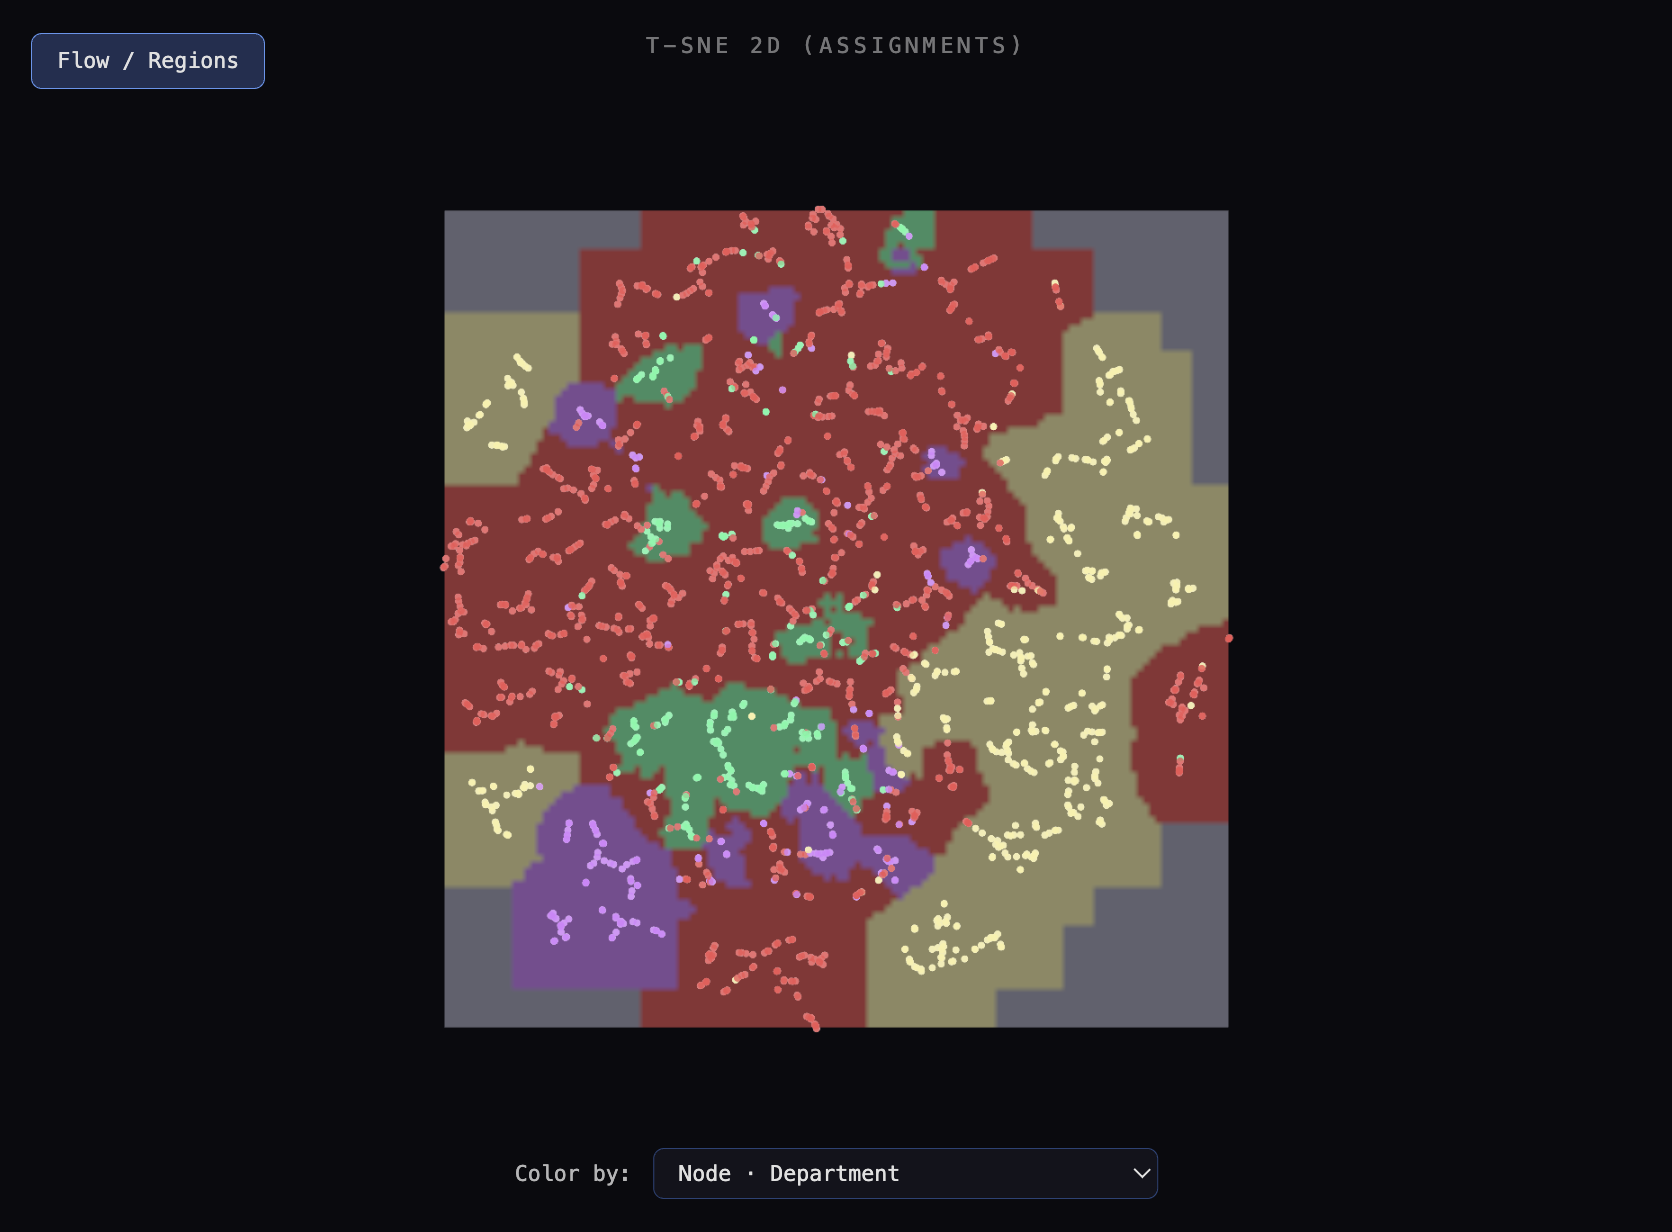
To better understand what the model learns, we visualize the hidden layer representations of assignment nodes using t-SNE dimensionality reduction. The resulting embedding space reveals structured clusters where assignments with similar operational attributes—such as task types, districts, and departments—are positioned close to one another. This indicates that the Graph Neural Network captures meaningful relational patterns in the scheduling system.